


Nailing the WebRTC Call Start
February 28, 2026
If you spend any time in the WebRTC space, chances are you’ve heard of rtcStats.com, the solution we are working on. It offers a powerful, streamlined way to analyze and debug WebRTC calls — think of it as a supercharged WebRTC-Internals 💊.
And as you already know, the first challenge when trying to resolve WebRTC-related issues is having enough information to investigate and understand them.
The problem is that asking end-users to download WebRTC Internals files manually is not always possible in production: Users need to be “educated” to perform the manipulation, and most of the time, they don’t care about it.
So, you need a solution to automatically collect, identify, and store information for all your calls, ready for a post-analysis on-demand. This means having the data available when someone complains about their call and asks why it failed.
Hopefully, I have good news: this solution exists and is completely free. It is rtcStats-server.
In this post, I will show you how to install and configure it to handle this entire scenario! 🎁
Note: This post completes the Automatically collecting webrtc-internals with rtcstats post done by Philip and Tsahi by using it differently. This finally shows how easy it is to deploy the full solution to fit your needs.
rtcStats-server is an open-source Node.js application that you can deploy “as it” in a container for being executed in your infrastructure.
It also comes with rtcStats-js, a JavaScript library used on the client side to gather WebRTC data.
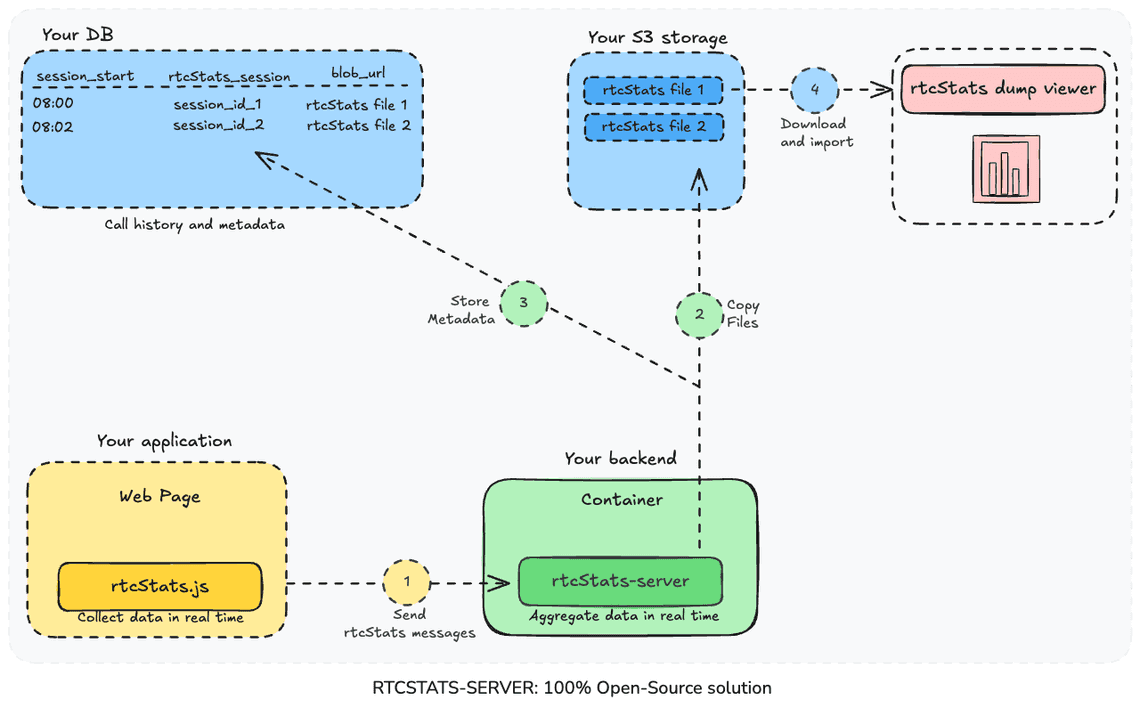
Here is how they work together: rtcStats-js connects to rtcStats-server and sends WebRTC statistics “live” at regular intervals. Meanwhile, the server aggregates the data and creates a rtcStats dump file the moment the call finishes.
Then, rtcStats-server backs up the file and saves the call metadata to your DB.
Lastly, we’ve included a rtcStats dump viewer that you can host yourself to inspect your files. It displays every metric on a single webpage—if you know WebRTC, you’ll love this view.
These three components provide a complete ecosystem to collect, store, and investigate your calls.
✨ 100% On-Premises ✨ — Your data stays with you!
As mentioned earlier, during a call, rtcStats-js continuously streams data to rtcStats-server. These individual messages combine to form the new rtcStats dump file.
This brings us to the main difference between a standard WebRTC-internals dump and an rtcStats dump: the new format relies on line-oriented JSON whereas WebRTC-Internals focus on individual statistics.
This format makes it easy to log additional context. For example, whenever your application calls a WebRTC method, a formatted message is sent to the server—allowing you to trace exactly what the application did and when.
rtcStats constructs a detailed timeline of the call by aggregating WebRTC events, methods called, statistics, and other relevant data points.
If you use rtcStats.com, you already know it handles WebRTC-internals dumps from any Chromium-based browser.
But did you know it also supports the rtcStats dump format? 🦸♂️
This means any dump file generated by your self-hosted rtcStats-server can be uploaded and analyzed directly on rtcStats.com. Don’t believe me? Give it a try!
One last secret: This new format was also recently introduced in Chrome M143! 2x🎁
Note: As mentioned in Debugging Janus sessions with rtcStats, this format is not new and has been around for a while. But this time, it will be used at a new scale, as proposed by Chrome.
Before we dive in, let me give you a quick overview of what I have in mind for playing with rtcStats-server.
I don’t want to install rtcStats-server locally on my machine. As I recently bought a Ugreen NASync DXP4800 Plus, I want to put it there for being always available.
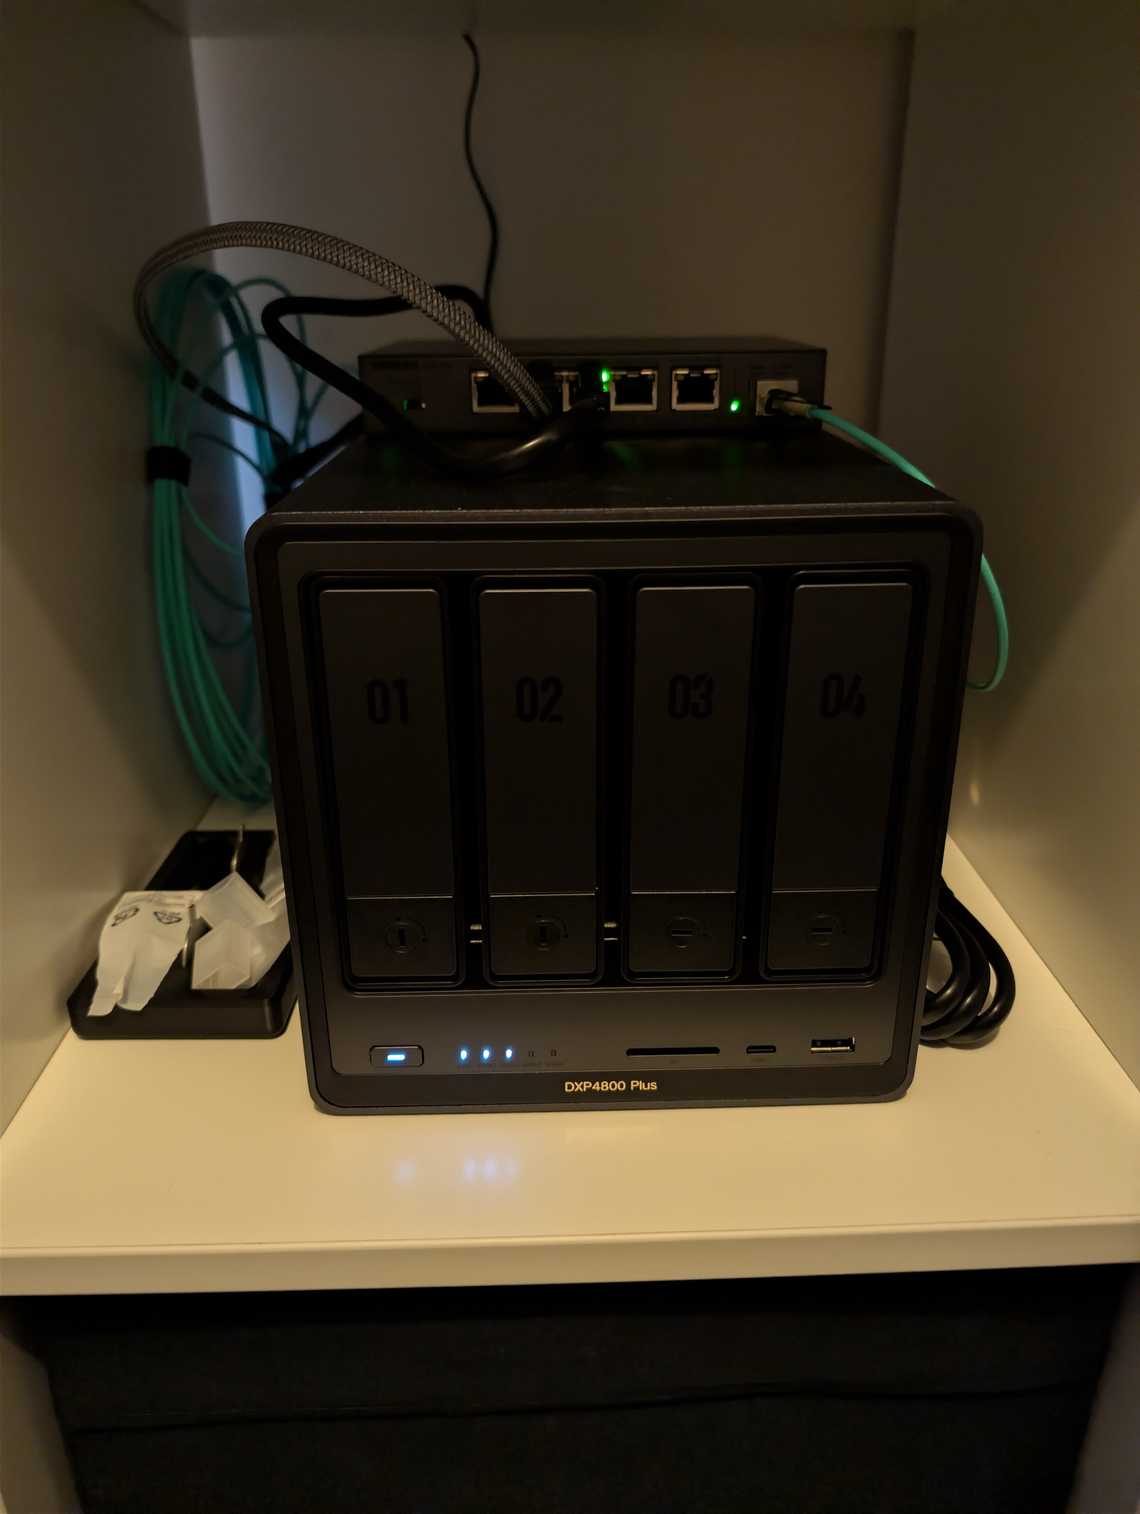
As Docker is available on this NAS, we can rely on the Dockerfile provided in the repo to build our image and run the server container directly.
For the demo, I’ll build a minimal React app and import rtcStats-js to handle the server connection.
To make things interesting, this React app will simulate a WebRTC call by creating two peer connections that exchange a fake video signal.
I’ll also spin up a Node.js app to generate a JWT token containing the call metadata. After all, you’ll want to be able to find the specific file associated with your call later!
For storage, I recommend Supabase because it handles both files and metadata in one place—perfect for showing you the full solution.
And for the grand finale, we will upload this file to rtcStats.com!
To succeed, I propose to install rtcStats-server using these 5 steps!
| Step | Goal | Check |
|---|---|---|
| 1 | Install it locally | → Health check should be ok |
| 2 | Make a call | → A rtcStats dump file should be saved locally |
| 3 | Configure the S3 storage | → A file should be sent there |
| 4 | Configure the DB | → A new item should be stored for the call |
| 5 | Identify calls | → The call metadata should be added to the DB |
Move on to Dockerization only when these steps are complete.
I have used the official rtcstats monorepo documentation.
# Clone the main repositorygit clone https://github.com/rtcstats/rtcstats.git# Navigate into the cloned directorycd rtcstats# Install all dependenciesnpm install# Start the servercd packages/rtcstats-servernpm start
Your server should be up and running. To check that everything is ok, use its /healthcheck api
curl -v http://<YOUR_LOCAL_IP>:8080/healthcheck
By default, the port that listens to incoming request is 8080.
Here, this means integrating rtcStats-js into your existing application.
# Install rtcStats-jsnpm install @rtcstats/rtcstats-js# Import the wrapperimport {wrapRTCStatsWithDefaultOptions} from '@rtcstats/rtcstats-js';# Somewhere in the startup of your applicationconst trace = wrapRTCStatsWithDefaultOptions();# Then when a call is about to start (accepted locally or remotely)trace.connect("http://<YOUR_LOCAL_IP>:8080");# Once the call is finishedtrace.close();
Things to notice:
close() finalize the call in progress by creating the rtcStats dump file in the upload directory.Before doing any changes, a good practice is to duplicate the default configuration file to keep a reference somewhere. Just in case of…
cd packages/rtcstats-server/configcp default.yaml default.old.yaml
Then update the configuration of the server to change the settings that automatically clean up the files. Edit the default.yaml file.
server:# HTTP port to listen on.httpPort: 8080# Directory where files are being stored while the websocket is still active.workDirectory: work# Directory where files are stored after preprocessed and when ready to upload.uploadDirectory: upload# Setting these to false is useful in dev environments where one needs to look at the generated files.deleteAtStart: falsedeleteAfterUpload: false# Whether to obfuscate IP addresses for privacy reasons.obfuscateIpAddresses: true
It’s time to do the call.
If everything is ok, you should see the following log in the server console
# When the call startedAccepted new connection with uuid <...># When the call ended and the client disconnectedConnection with uuid <...> disconnected, starting to process data# Once the processing finishedProcessed data from connection with uuid <...>
And you should see a new file in the upload directory.
If everything is ok, you can jump to the next paragraph, but in case there is no new file in the upload directory, check this troubleshooting guide
| Where | What to check |
|---|---|
| Source code | Wrong library usage Check that you call the connect() and close() methods when the call starts and ends.→ If you forget to call the close() method, the file will not be generated as the connection is still opened |
| Application | Connection issue Go to the Developers tools and open the network panel Check for any issues with the WebSocket (connection failure) → Change the port in the client if wrong or check that the server is reachable on this port. |
| Server | Missing application token Open the server console Check for message Authentication is configured but rtcstats-token is missing→ Remove the jwtSecret value from the configuration at this time |
| Server | Storage configured Open the server console Check for message Storage not configured, skipping.→ If you don’t see this message, this means you have configured the storage. Reset it at this time |
| Server | Files auto clean-up Open the configuration and check that the options deleteAfterUploadand deleteAtStart are set to false→ When true, files are removed even without storage configured |
| Server | Wrong work or upload path Open the server console Check for message Creating working dir <dir> ENOENT: no such file or directory→ If you see this message, this means that the server can access the path configured in workDirectory or uploadDirectory |
| Server | Bad parsing of configuration file Open the configuration Check if the file is still correctly aligned (tab) → Restart from your backup configuration file in case of |
| Server | Unexpected things Open the console Check for any strange or crash messages that can give a hint. → Open an issue on Github with this error |
Note: If you are here, this means that you have successfully generated rtcStats dump files on your server.
This is the most important part. The rtcStats-server can be configured to use a S3 bucket as its storage backend. For that, we need to update the configuration file again.
Complete the file with your S3 credentials (or Supabase, Digital Ocean Spaces, etc.).
As I want to upload in my free Supabase S3 bucket, I put the following
storage:s3:forcePathStyle: trueregion: eu-north-1endpoint: https://<ID>.storage.supabase.co/storage/v1/s3credentials:accessKeyId: "YOUR_ACCESS_KEY"secretAccessKey: "YOUR_SECRET_KEY"bucket: rtcstats-server
Here is the troubleshooting guide for this part
| Where | What to check |
|---|---|
| Server | Missing forcePathStyle Open the server console Check for message errno: -100, code: 'EPROTO',syscall: 'write',→ Add the parameter the forcePathStyle: true to the configuration |
| Server | Bad endpoint Open the server console Check for message Error: char 'P' is not expected.:1:1→ Replace the value of endpoint in the configuration. It could be the wrong project id to use |
| Server | Invalid Access Key Open the server console Check for message InvalidAccessKeyId: The Access Key Id you provided does not exist in our records.→ Replace the value of accessKeyId in the configuration |
| Server | Bad region or secretAccessKey Open the server console Check for message SignatureDoesNotMatch: The request signature we calculated does not match the signature you provided. Check your key and signing method→ Check and replace the values of region and secretAccessKey in the configuration. The same message for these parameters |
| Server | Incorrect Bucket name Open the server console Check for the message NoSuchBucket: Bucket not found→ Check and replace the values of bucket in the configuration |
By configuring the database, you can save session details like call duration and the associated filename. This ensures you can always locate the right file when you need it.
Because we are using Supabase, setup is easy—just run these commands:
# Run this command to sync your account properlynpx supabase link# Run this command to prepare the Database (SQL queries)npx supabase db push
For other environments, you need to prepare the DB manually. Nothing complicated, just some SQL statements to execute.
# Go the the migrations directorycd packages/rtcstats-server/supabase/migrations# See the SQL statements to execute from all filescat 20251103140656_initial-setup.sql...
Then, the next step is to configure the database section in the configuration
database:# Database settings, postgres and supabase primarily.postgres:tableName: rtcstats-serverconnectionString: postgresql://<user:passsword>@db.<id>.supabase.co:5432/postgresssl: # https://node-postgres.com/features/sslcapath: ./certificates/prod-ca-2021.crtmode: # e.g. 'verify-full'.
This one is a bit more complicated to fill.
To note:
tableName should be rtcstats-server as defined in the migration scripts.connectionString is your PostgresQL connection URL to access the databasecapath is the certificate authority. I have downloaded it from Supabase directly.Here is the troubleshooting guide for this part
| Where | What to check |
|---|---|
| Server | Wrong Table name Open the server console Check for message PostgresError: relation "xxx" does not exist',→ Replace the value of tableName by rtcstats-server in the configuration |
| Server | Wrong Connection String Open the server console Check for message PostgresError: password authentication failed for user "postgres" or equivalent→ Replace the value of connectionString in the configuration. Check the user/password and id used |
| Server | Missing Certificate Open the server console Check for the message TypeError [ERR_INVALID_ARG_TYPE]: The "path" argument must be of type string or an instance of Buffer or URL. Received null→ Fill the value of capath by the path to your certificate. |
| Server | Wrong Certificate Path Open the server console Check for the message Error: ENOENT: no such file or directory, open '...'→ Replace the value of capath by the path to your certificate. Current path or file name is not correct |
This is the last step to configure but the most important one if you are dealing with a huge number of calls.
There are two parts:
Here is a snippet to generate your token from a Node.js application
import jwt from 'jsonwebtoken';export async function generateAuthToken(rtcStatsData, secret, expiresIn = 3600/*seconds*/) {return new Promise((resolve, reject) => {jwt.sign({rtcStats: rtcStatsData}, secret, {expiresIn}, (err, token) => {if (err) {reject(err);return;}resolve(token);});});}// create your token (somewhere in your backend code)const token = await generateAuthToken({user: 'jid_olivier@rtcstats.com',session: 'cs20251201-122358-295035',conference: 'callId-1234567890'}, "mysharedsecret", 24*3600/*1d*/);
rtcStats-server offers 3 levels of call identification:
Note: Don’t forget to configure the jwtSecret in the configuration file with the same value used to generate the token.
Then, update your Web application to use this token
// Somewhere in your code, get the token to useconst token = fetchToken(userId, sessionId, callId);// Connect using a tokentrace.connect(`http://<YOUR_LOCAL_IP>:8080?rtcstats-token=${token}`);
If you did it right, this information will be added to the database for each call.
Here is the troubleshooting guide for this part
| Where | What to check |
|---|---|
| Server | Malformed Token Open the server console Check for message JWT authorization failed JsonWebTokenError: jwt malformed→ The token is not valid. Change the way you generate it |
| Server | Missing Token Open the server console Check for message Authentication is configured but rtcstats-token is missing→ Add the token on the Web application in the connect() method |
| Server | Expired Token Open the server console Check for message JWT authorization failed TokenExpiredError: jwt expired→ The token used is no more valid. You need to create a new one. Check your token policy to avoid this issue |
🏁 The following section covers Dockerization. If you aren’t using Docker, then congratulations—you’re done! Your server is completely configured! 🚀
As mentioned, there is a dockerfile.
So now that the configuration is done properly and tested, you can create a Docker image.
As I want to use it on the NAS, I copied all the repo to a share directory. Then I connected using SSH.
# replace by your NAS IP address and your loginssh Olivier@<YOUR_NAS_IP># Go to the folder you just uploaded (complete repo + configured configuration)cd /volume1/docker/rtcstats-server# Build the imagedocker build -t my-rtcstats-server .
It should take some seconds, and then you should see a successful message.
The last step is to create a new container and execute it.
For this, I will use Portainer.
Note: To install Portainer, I follow this great tutorial How to install Portainer on your UGreen NAS.
To create the container:
| Steps |
|---|
Log in to Portainer using http://<YOUR_NAS_IP>:9000 |
| Go to the Containers section Click on Create a new container |
| Enter the name of the image you just built, if everything is ok, it should propose an auto-completion. |
| Map the port needed to connect the WebSocket. By default, it is 8080 |
| Click Deploy the Container and wait for it to complete. |
Try a test to be sure the port is correctly opened.
🏁 This time this is really the end.
Your rtcStats-server container is up and running 👏👏👏
This final step allows you to analyze your calls.
Download the file from your bucket and head to https://www.rtcstats.com/.
Simply drag and drop the file onto the Upload page.
Now you are ready to debug your WebRTC session and see what we discovered!
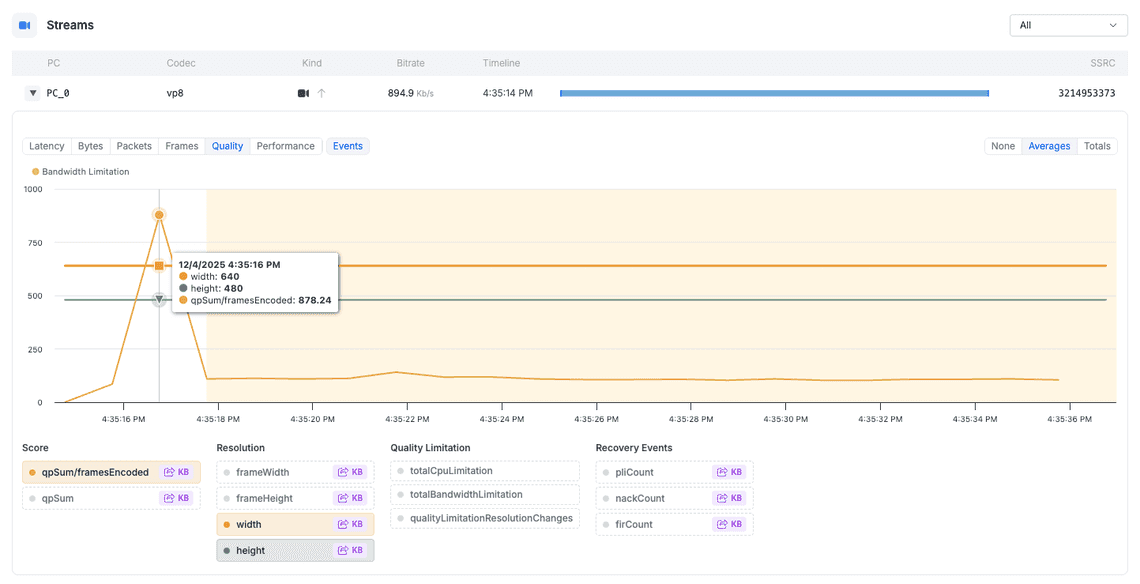
While self-hosting requires some initial effort, having a robust debugging process is invaluable. You will finally have the data you need to understand why calls fail.
Want to speed up your analysis? Upgrade to a Developer license to benefit from our advanced observations and pinpoint issues faster. Plus, you can share the access with up to 10 teammates.