


Anatomy of a WebRTC Connection
June 30, 2025
Starting a WebRTC call often feels like magic. You click a button, and suddenly you’re seeing and hearing someone halfway across the world.
For developers, the standard state machine makes it look easy: you wait for the connectionState to turn connected, and you’re good to go. But as any seasoned WebRTC developer knows, the big climb ⛰️ starts when your app hits real-world corporate networks.
A “good start” isn’t just about reaching a connected state; it’s about how fast you get there and how quickly you recover when things go wrong.
In this post, we’re looking at why calls sometimes hang in a “zombie” state and how a proactive architecture can save your user experience.
Note: This post primarily targets desktop browsers and applications. On mobile, some adjustments (particularly around timeouts) may be required.
From a user’s perspective, there is nothing more frustrating than a call that looks like it’s starting but delivers only silence.
You see a “Connecting…” spinner, or worse, the UI says “Connected,” but you can’t hear anything.
The technical reason is often that the ICE (Interactive Connectivity Establishment) mechanism is too conservative. By default, browsers wait for internal timeouts. Sometimes up to 15 seconds, before admitting a connection has failed.
If a network path is blocked or a socket is aborted by local security software, most of the time, the error is reported to the application lately, so the ICE restart might be triggered far too late. The user has usually hung up in frustration long before the browser decides to try a different path.
Here are some scenarios you may encounter.
Here, the browser reports ICE Connected after a normal checking phase, and DTLS completes quickly. However, immediately after the peer connection enters the connected state, internal STUN binding requests start failing silently behind the scenes.
If you inspect the Chromium logs, you’ll see messages like:
UDP send of 96 bytes to host 172.10.10.x:21345 failed with error 10053
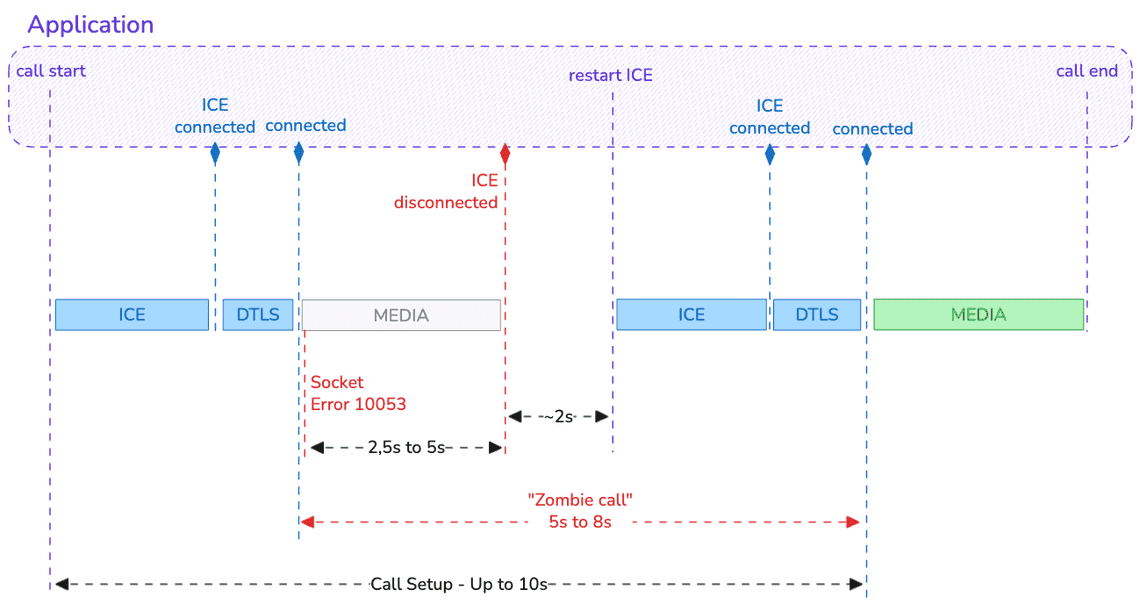
In short, the socket was successfully established but then forcibly closed by “a software on your host computer”.
Typical culprits include an antivirus, a local firewall, or a security tool such as Zscaler.
From the application’s perspective, everything looks fine: the browser API gives a green light. Internally, though, the responsesReceived counter stalls 🤔
This is a Zombie call or connection: The state machine is happy, but no media can actually flow.
If nothing is done, the application will receive an ICE disconnected event about 5 seconds later (≈2.5 seconds to flag the receiving state and another ≈2.5 seconds for the sending state).
In most implementations, an ICE restart is triggered only after waiting an additional ~2 seconds, to give the stack a chance to recover on its own. But if you do nothing, you can wait for a long time before receiving the ICE failed event…
During all this time, the receiver cannot hear the caller. Depending on network latency, it can take 8 to 10 seconds after call start before the call is finally established successfully.
This is essentially the same scenario, but without error 10053 being reported by the stack.
My suspicion is that error 10053 occurs only on inbound calls (from an ICE perspective, which means when receiving the offer). However, I haven’t seen enough cases yet to be fully confident.
From the user’s perspective, the outcome is identical. If no special handling is implemented, it will still take around 8 seconds for the call to become usable.
In this scenario, the ICE state reaches connected, but the DTLS (security) handshake gets stuck in an exponential backoff loop.
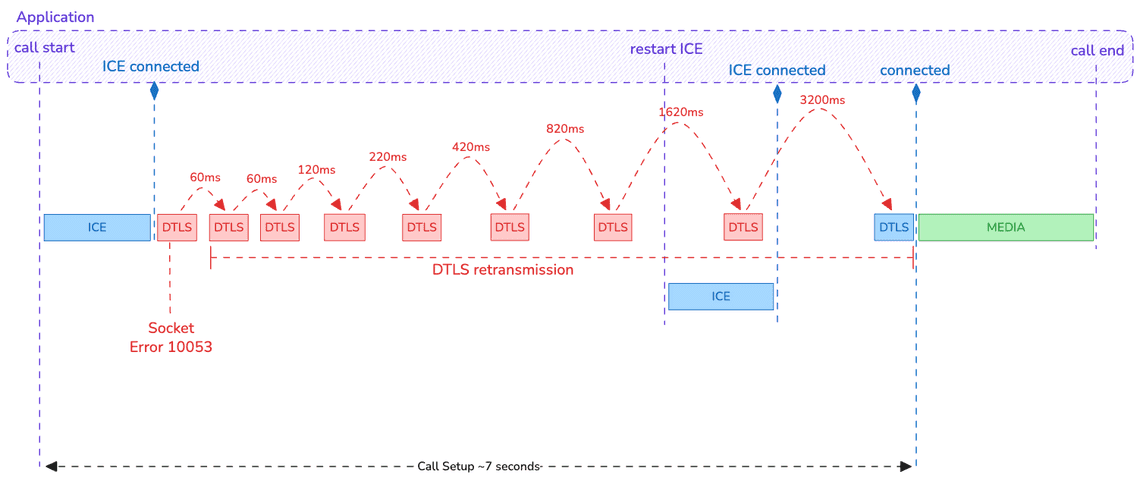
Why does this happen? Simply bad luck: error 10053 occurs during the DTLS handshake. As a result, the stack attempts to request retransmissions from the remote peer—but it can’t, because the underlying socket has already failed.
The real problem is that these retransmissions are scheduled with an increasing delay. Even if the first retry is quick (typically under 100 ms, depending on RTT), the delay grows rapidly. If the connection does not recover fast, you can easily end up with more than 3 seconds between two attempts and without terminating the DTLS handshake even if the connection is established again… 🤯
This situation becomes especially problematic if the application is not reactive once the ICE state switches to connected. On a typical desktop setup over Wifi or LAN, the DTLS handshake should complete within 1.5 to 2 seconds (roughly 2 RTTs). If that threshold is exceeded, the application must react rather than wait passively.
In this example, the restart ICE is triggered 3 seconds after ICE Connected if the DTLS is yet finished successfully.
Last but not least, an other frustrating case is what we can call the “ghost in the machine”: Error 10055 (WSAENOBUFS).
This is a system-level error where the operating system reports “no buffer space available” even though, in theory, everything should be empty.
This is currently a known issue in Chromium that primarily affects the very first WebRTC call after a machine restart on Windows 11, when using a Chromium-based browser such as Google Chrome, Microsoft Edge, or an Electron-based desktop application.
It causes the first call to fail immediately. Like for other cases, it causes a long delay (around 6-8 seconds) before a call can be successfully established due to the late fire of ICE events.
If the application simply waits for this ICE failed event, it will likely occur after the local call initiator has already hung up… 🙅
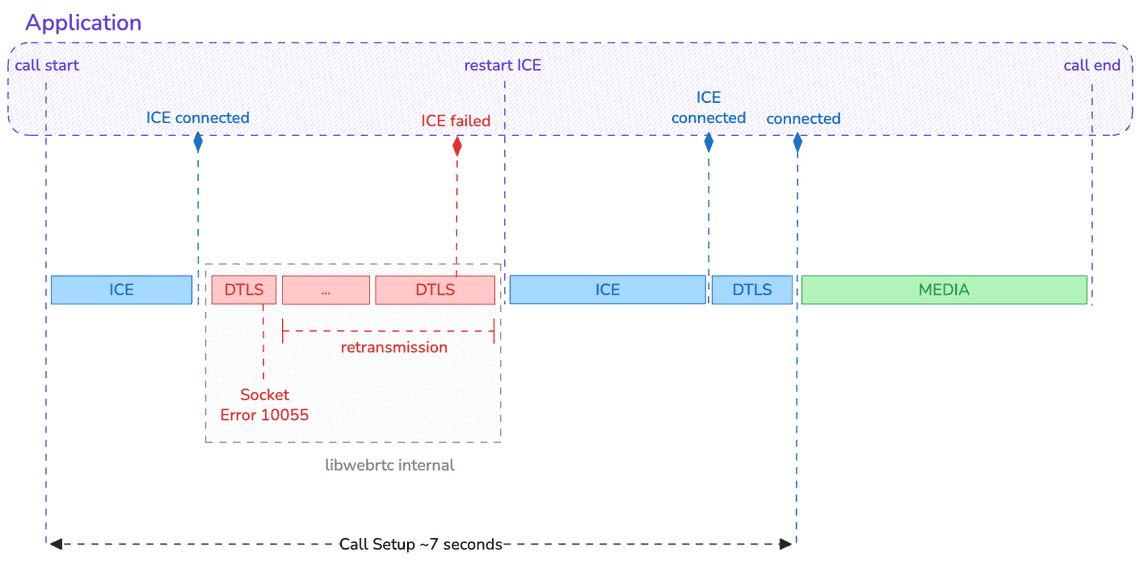
So far, no retry mechanism was in place. A potential fix is currently being implemented to perform several attempts and 🤞 increase the chances of establishing the connection.
But should we rely only on this potential correction ? 👇
There is no mistake:
“By minimizing the call setup time, you significantly improve the likelihood that a call is successfully established”.
For that, you need to detect as early as possible when the underlying transport is stalled and trigger an ICE restart immediately.
How? By inferring transport health signals instead of passively trusting connection states.
Practically, you will need two things that you already have it:
A call state machine: The ICE state and the peer-connection state alone are not sufficient. You need to be at the call level.
Statistics collection: The detection logic relies on data exposed by the getStats API and not only on ICE/peer-connection states.
Here is how it looks like from a high level view
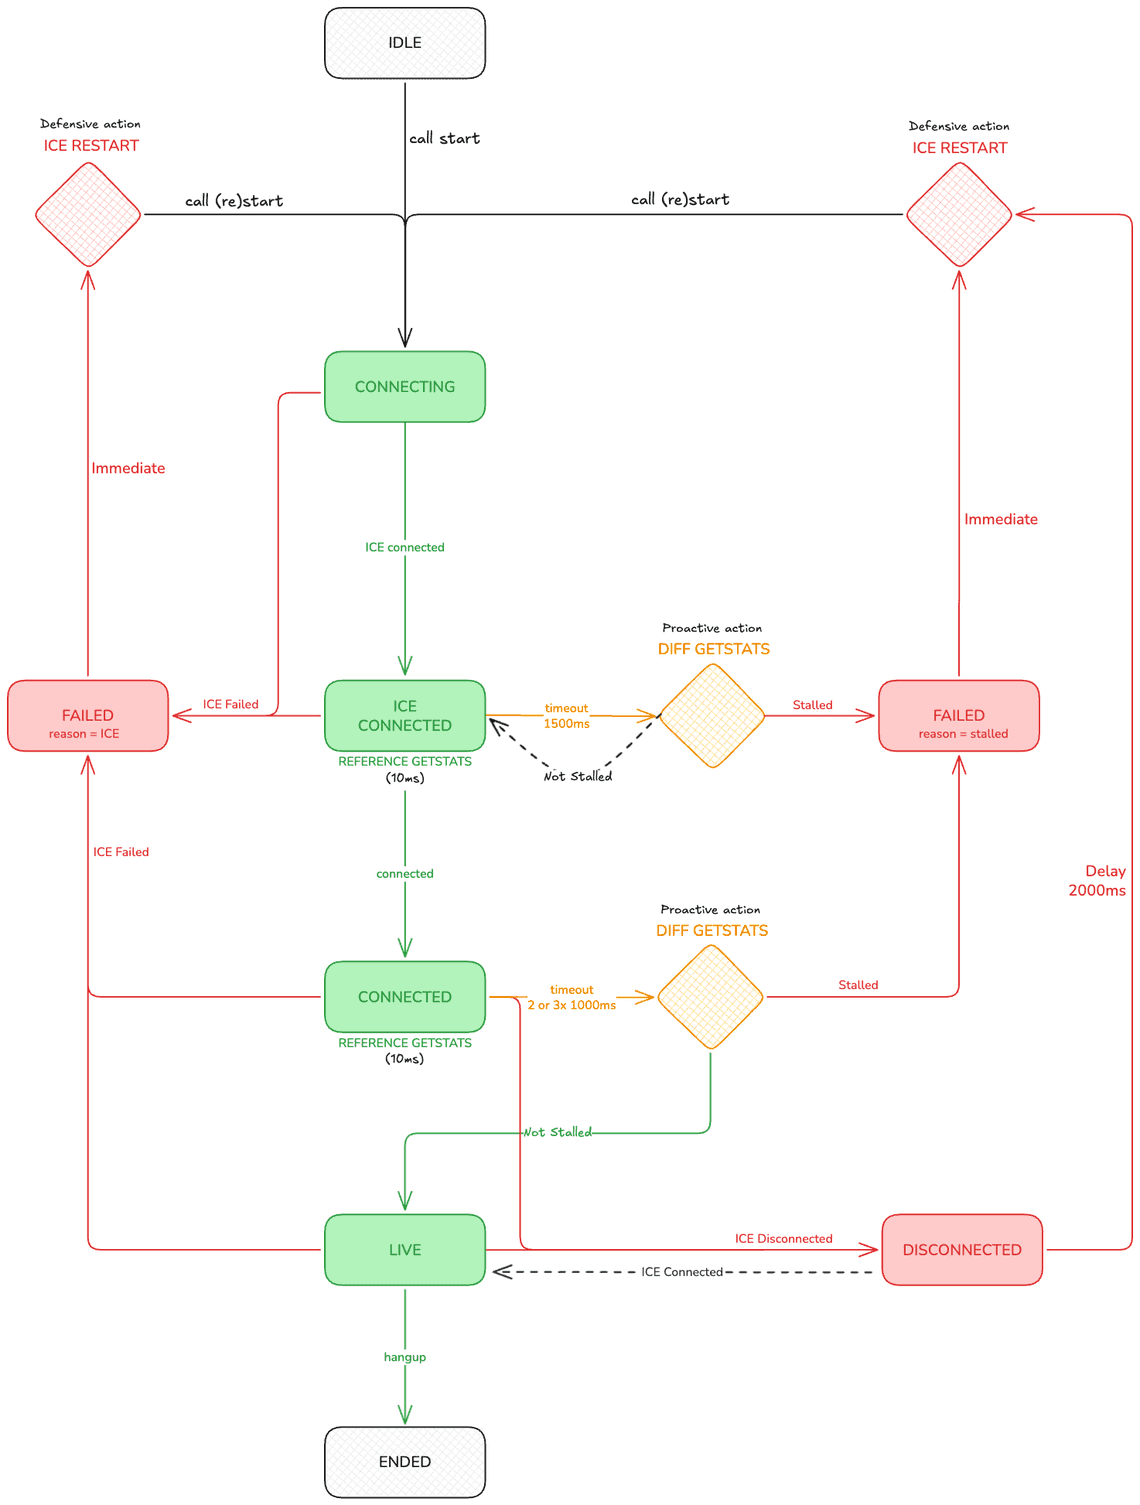
The key ideas are:
Detecting when stalled: This can be done by monitoring either responsesReceived or bytesReceived (using the audio call case as an example).
Introducing a new “live” state: This state indicates that the call is truly established from a transport perspective on both sides.
Then, if the microphone is not working, that’s a different problem altogether. 👾
We define a churned connection as a disconnection that occurs shortly (within a few seconds) after the call is “ICE connected”, followed by a successful reconnection.
As illustrated in the previous cases, from the application’s point of view the root cause is not identifiable unless Chromium logs are collected. In practice, the only signals you receive are ICE failed or ICE disconnected events and stalled statistics, nothing more.
That said, the pattern itself is identifiable. By observing what happens during call establishment, you can detect these situations and count how often they occur.
And that’s the key point: you now have a meaningful KPI that you can expose, track over time, and use to measure progress and improvements.
I have a secret for you. Using the on-premise open-source rtcstats-server to collect the call statistics combined to the rtcStats API available as a service to analyze them, you will be able to detect not only the Churned Connection but also more than 80 others potential issues. 🦸
No magic then. Store these data in your own DB to order the issues that affect the most your calls. And act!
A successful WebRTC connection is more than just a connected event.
It’s a validation that media is actually flowing. By moving away from a passive “wait and see” approach and adopting a proactive architecture that monitors low-level packet stats, we can bypass the delays caused by system errors, antivirus interference, or buggy network drivers.
Trust the data, monitor the diffs, and be ready to restart before your user even knows there was a problem.