


Practical Guide for Call Center Agents
March 27, 2026
A user opens a ticket:
“Hi support, I received a call early this morning but at no point during the call did I hear the caller. Session was with my colleague Marc around 9:00 AM.”
Today your support team writes back something like this: “Could you send me your logs? I will forward them to the engineer in charge.” That message buys you a day or two, maybe a week, before someone figures out what actually happened on that call.
In the coming months, the reply is going to look very different. Something like: “Could you check your USB headset, we have detected an issue preventing the sound from coming through.”
Not “send me the logs.” A specific, actionable suggestion. Tied to the actual root cause. Often before the engineer is even involved.
That shift is what this article is about. I want to walk you through what I see as five distinct ages of WebRTC customer support.
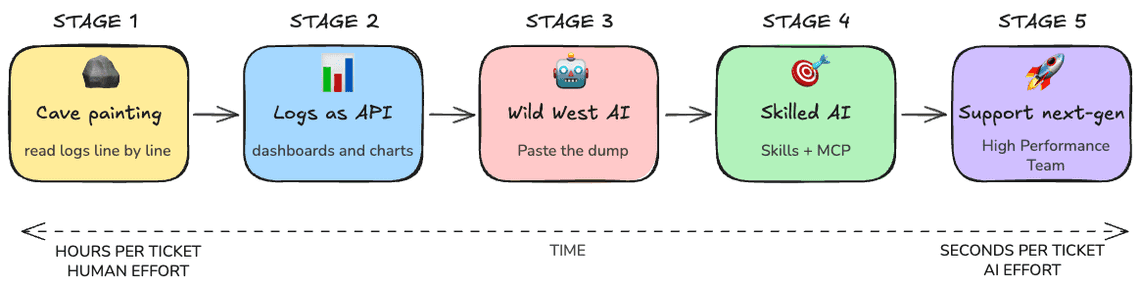
I am writing this as someone who has lived stages 1 and 2 the hard way, watched stage 3 stumble in front of customers, and is currently building stage 4 and 5.
If you run a media service, whether it is a contact center, a video conferencing product, a telehealth platform, or any kind of live collaboration, this is your team’s daily life. Worth knowing where it is going.
Now let me show you how each generation of WebRTC support handles it.
There is no telemetry pipeline. There is no dashboard. There is chrome://webrtc-internals, there are Chromium debug logs, and there is grep. 🪨

You reply through the ticketing system.
“Could you launch Chrome with the WebRTC verbose logging flags enabled, open chrome://webrtc-internals in a first tab and then reproduce the issue in a second tab, and send me both files?”
Now you have a problem. Asking a non-technical user to start Chrome from the command line, then reproduce the issue, then collect the dump, is a multi-message back-and-forth inside the ticketing tool.
Some users will give up. Some will send you the wrong file. Some will reboot before exporting. Three days later, if you are lucky, you get a usable artifact.
When the logs finally arrive, you open them in your editor. The dump is megabytes of JSON. The verbose log is even bigger. You start scrolling.
Two hours into the dump, after reading the application logs, the webrtc-internals file and finally reading the interesting Chromium log.
The conclusion: Whatever is between them, a firewall, an SBC, a corporate proxy, a network policy, started silently dropping traffic. No media at all during this short session.
You reply through the ticketing system.
You solved it: the IT administrator had changed a piece of equipment.
It took 2 hours, three days of back-and-forth with the user and a non-trivial amount of mental energy. This is debugging by archaeology. It works. It does not scale. Every WebRTC team that has shipped a real product has lived this. Most still do, more often than they would like to admit.
The first leap was not AI. The first leap was treating logs like a versioned interface instead of a free-form text dump. 📊
Someone on the team gets tired of staring at raw getStats() output and writes a parser. The parser knows the schema. It builds tables. It plots state transitions.
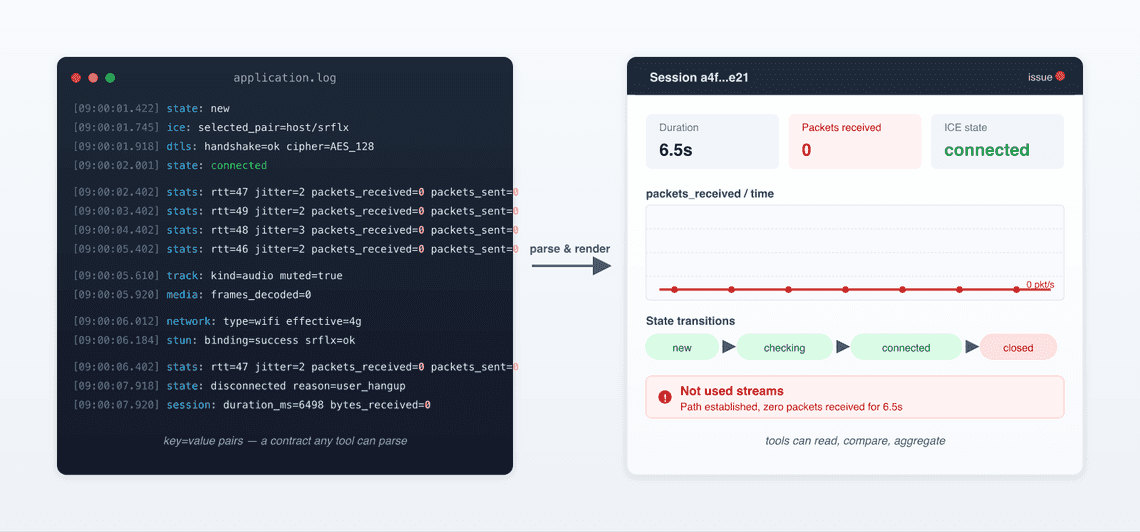
The dump format became a contract, now superseded by the re-emerging rtcstats format. Tools could read it. Tools could compare two sessions side by side. Tools could compute aggregates across a fleet.
Back to our ticket. You paste the session into your dashboard. You see a timeline. The dashboard annotates this in red: “Not used streams”.
In stage 1, the engineer saw the technical fingerprint of the failure. In stage 2, the dashboard surfaces it from charts and diagrams instantaneously.
The Chromium debug-log dance is also gone, because the structured dump captured the signal already.
The teams that built or adopted these tools, contact centers monitoring SLAs, video platforms watching call quality at scale, pulled ahead of teams that did not.
But notice what stage 2 does and does not do. It surfaces patterns. It does not interpret them. It does not tell you the most likely root cause among a dozen possibilities. That part is still on the engineer.
This is where most WebRTC teams sit today. Some are still climbing out of stage 1. A growing number are pushing into stage 3.
ChatGPT lands. Claude lands. 🤖 Suddenly every engineer with a problem and a log file thinks the same thing. What if I just paste this into a chat and ask?
So you do. You take the dump. You realize the dump is several megabytes and the model has a context limit. You truncate it. You paste 30 thousand tokens of getStats snapshots and ICE state transitions.
You ask the model “no audio during this call, what went wrong?“.

The model gives you an answer. The answer sounds plausible. It mentions NAT traversal and a possible TURN server misconfiguration. It suggests you check your codec negotiation. You read it three times. You notice it has hallucinated a stat that does not exist.
You ask a follow-up. The model contradicts itself. You spend an hour iterating. You burn 150 thousand tokens. The bill is real. Eventually you arrive at “probably a firewall issue”, which your stage 2 dashboard already implied in 3 minutes.
I call this the wild west age, and I do not mean it as a compliment:
Too much context: Whole dumps dropped into a chat window. The model drowns and starts pattern-matching on the wrong details.
Too little context. Snippets pulled out without the surrounding state. The model invents.
A general-purpose LLM does not know that “STUN binding success drops to zero a few ms after pair nomination” is a fingerprint for stateful-firewall path filtering, not for codec negotiation problems.
No grounding. The model cannot verify its claims against the source data, your code, or the WebRTC spec.
The honest read is that stage 3 is a transitional phase. It feels like progress because the LLM can talk fluently about getStats.
It is not real progress, because the answers are unreliable and the cost is bad.
A lot of teams are stuck here right now. They have an AI tool. They are not getting much from it. They are starting to wonder if AI is overhyped.
It is not overhyped. They are using it wrong.
The mistake at stage 3 is asking a general-purpose model to do a specialist’s job with the wrong tools. Stage 4 fixes that. 🎯
Three things change.
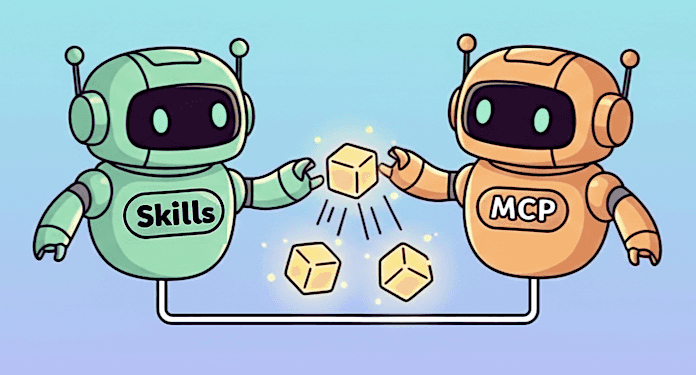
The AI gets WebRTC skills: You give it the rules. You tell it how to find WebRTC knowledge, how to interpret specific cases. You codify what a senior WebRTC engineer would notice in the first 30 seconds, and you make sure the AI uses that lens.
The AI gets tools not raw logs: This is where MCP comes in. Short for Model Context Protocol, it is a standard for letting AI agents call functions instead of being handed flat blobs of data. rtcstats knows how to dissect statistics, just call it using its MCP end-point to get observations and data that matter.
The AI gets sources not just stats: Issue trackers, source code, the spec, prior incident reports. Connect to several input sources to get valuable contexts and expose any of these as tools the agent can query when it needs to verify a hypothesis or pull a known pattern.
The catch is that all of this lives on the engineer’s machine. The analysis happens locally, in their environment, with their tools.
And we are still on the R&D side, speaking R&D’s language. The engineer still has to translate their findings into something the ticketing system, and the customer, can understand.
It is a real step forward but not yet enough.
Those skills can be anything specific to your business. For me, it is the deep telco knowledge around our OXE PABX, the SIP interconnects, and so on. In short, everything that still lives inside R&D’s heads as “experience” and has never been written down anywhere.
Stage 4 helps your engineers. Stage 5 helps your business. 🚀

Here is the thing about WebRTC support that most engineering teams underestimate. The L1 support agent who first opens the ticket is rarely a WebRTC expert. Often they are not even a deep technical person. They sit in a welcome center, they have high turnover, and their main job is collecting the right artifacts: logs, timestamps, session ids, browser version… They forward the package to the next level. Engineering investigates. Several days pass. The customer is unhappy.
That handoff is where most of the cost lives: not in the engineering time per ticket, but in the latency.
Stage 5 is what happens when the AI pipeline runs before a human ever opens the ticket. The user reports the missing audio. The session is matched to the complaint automatically by timestamp and user id. The stage-4 analysis runs in the background. The ticket lands in the L1 queue already enriched.
The L1 agent does not see a raw dump. They see something like this.
Pre-analysis (confidence 87%):|- Session connected.|- No media.|- No error reported.|- Short session lasting a few secondsInvestigation areas:- Network- Locally installed softwareSuggested response template:|- "A piece of network equipment or some installed software probably blocked the session just after it was established."|- "Nothing wrong with the application itself or the user's audio device."Suggested actions:|- Ask the customer to check any configuration changes made recently on the local network.|- Check for a firewall or any protection software installed.
And with helpful insights for the Customer team:
Explanations:|- "Session connected": derived from the WebRTC internal connection state reaching"connected" in the log file (iceConnectionState: "connected", around line 534).Concretely: the two peers found a working path and the call was set up. This rulesout sign-in and signaling as the cause.|- "No media": derived from the inbound stats showing bytesReceived staying at 0 forthe whole session (audio inbound-rtp, around line 612), while the connection stateis still "connected". So the call was established but no sound ever flowed.|- "Network or local software" conclusion: put the two facts together. The callactually connected, but no sound ever came through, and there was no error messageexplaining why. When the app itself is at fault, it usually complains in the logs.Here it stayed silent, which points outside the app: something between the user andthe other side (a firewall, a VPN, a proxy, or antivirus / security software on themachine) let the call start but quietly blocked the sound.|- One more clue: the session was very short, only a few seconds. It ended before thesoftware even had a chance to retry or recover, so we never see a second attempt.A call that dies that fast, right after connecting, is typical of somethingactively cutting it off rather than a slow or flaky network.Potential similar issues:|- [issue52342]: First call of the day is never establishedUseful links:|- [RTCPeerConnection.iceConnectionState (MDN)] - the exact value we read in the log.|- [Identifying and Debugging WebRTC issues with getStats - where the `bytesReceived` metric comes from.|- [Nailing the WebRTC call start (webrtc-developers.com)] - why a call can connect yet fail to carry media right at the start.
Two things follow from this:
Loyal Customers: Your L1 team becomes drastically more useful. Their hit rate on first-touch resolution goes up because they have a starting point instead of a wall of unknown. Less pressure on R&D. Fewer escalations. Faster customer responses. All leading to happier customers, and so customers who stay. They trust you.
Save time, when an issue does need engineering, it arrives with the analysis attached. Your developer does not start at zero. They start at “here is the suspected root cause and a pointer to the relevant code path; confirm or refute”. That alone collapses investigation time.
A small number of teams are moving into this stage. Those who invest will have a better chance to keep their customers.
I have been doing WebRTC for a long time. I have done the archaeology. I have built the dashboards. I have watched engineers waste afternoons in chat windows asking the wrong questions. I think the stage 4 and stage 5 shift is the most consequential one I have seen in this corner of the industry.
The reason we built rtcStats is exactly this. We wanted a tool that does the boring parts of the support workflow well, runs at the cost structure that makes sense at scale, keeps customer data where the customer wants it kept, and exposes its analysis through an API and MCP so it can drop into whatever ticketing or monitoring stack you already have.
Here is a draft of how AI can be integrated into the Customer Support process toolchain.
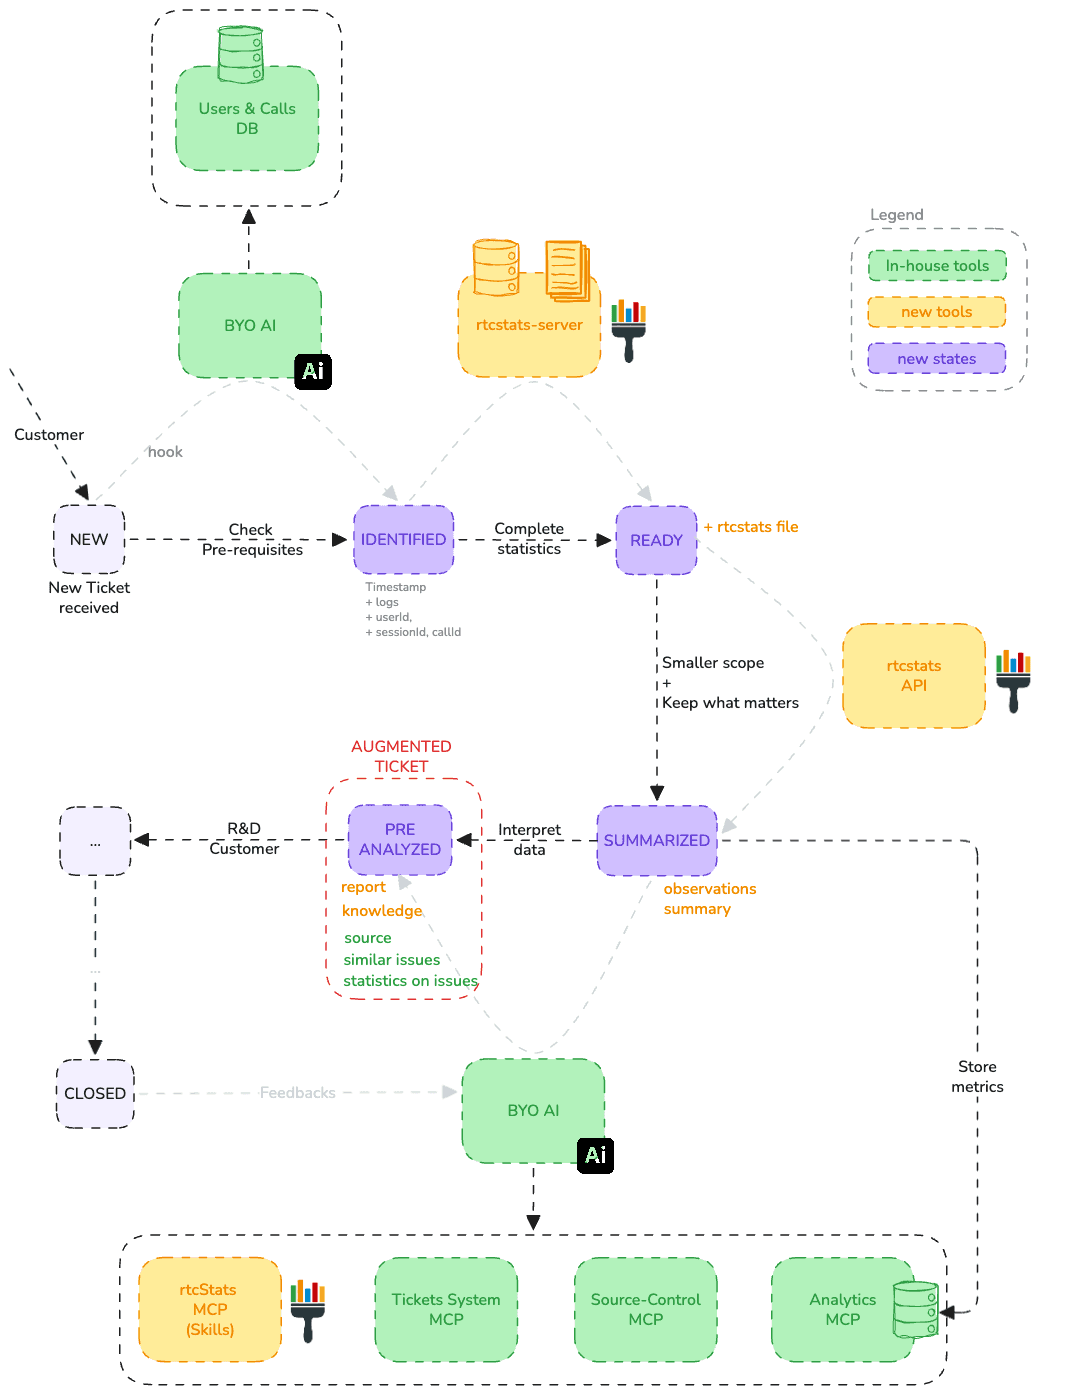
There are three outcomes:
Augmented tickets: The original ticket is enriched with everything the AI has produced, the full analysis, the suggested actions, links to similar issues, and statistics from previously analyzed tickets that flag which other customers are likely hitting the same problem.
A feedback loop: Once the ticket is resolved, the AI revisits it and validates its own outcome, strategy, and reasoning, learning from what actually fixed the issue so the next analysis is sharper.
A growing Customer Care team: Knowledge and explanations are also handed back to Customer Care, leveling up the team over time so they handle more on their own.
I am not going to tell you AI will replace your support team. This is the opposite. I do believe AI will replace the boring part and be the partner of the Support team.
Ask yourself the real question: what is the actual job of your Customer Support? Is it only to gather materials and forward them to R&D, or is it to truly guide the customer and help them get the most out of your solution?
With AI, your support team has more time to spend with the customer doing exactly that.
Once you shift Customer Support toward that role, the benefits compound at three levels: the customer, the brand, and the company itself.
Customer satisfaction is the big win: less latency, valuable insights delivered directly to the customer.
The company’s brand image improves, and customers grow more confident in you.
The company’s overall efficiency improves: R&D keeps a steady pace instead of being constantly pulled into firefighting, and Sales can focus on finding new leads rather than putting out customer fires.
And me?
Fewer tickets to analyze, fewer interruptions, less stress… I’m a happy developer who still loves solving problems.