


Nailing the WebRTC Call Start
February 28, 2026
WebRTC provides powerful capabilities for direct peer-to-peer audio, video, and data exchange within web browsers and native applications. However, the asynchronous nature of its connection establishment and the complexity of the underlying network negotiation processes mean that robust state management is not just a feature, but a fundamental requirement for building reliable applications.
Many perplexing bugs, user experience issues, and difficult-to-diagnose failures in WebRTC applications can be traced back to an improper handling or misunderstanding of the various connection state transitions.
This article aims to demystify the critical WebRTC connection states. Furthermore, it will try to give actionable strategies and best practices for handling common challenging scenarios, such as ICE failures, DTLS handshake issues, and verifying actual media flow.
Mishandling these states can lead to a host of common pain points for users and developers alike 🫠.
These include calls that appear to connect but result in no audio or video, connections that drop unexpectedly without clear reasons, user interface (UI) elements that fail to accurately reflect the true status of a call, and significant difficulties in implementing reliable reconnection logic.
Such issues inevitably lead to user frustration and can severely undermine the perceived reliability and quality of an application.
The challenge often lies in the fact that developers might react to broad WebRTC problems, such as a generic “call failed” notification, rather than proactively monitoring and interpreting the granular state changes that could predict or precisely diagnose an issue.
A lack of deep understanding of the WebRTC state machine can lead to generic error handling, which is frequently insufficient for depicting every issue: For instance, simply knowing a call “failed” is far less actionable than understanding at which specific stage—be it ICE negotiation, DTLS handshake, or media transport—the failure occurred.
The following image offers a timeline of events and state changes that occur during the establishment of a WebRTC call between “Bob” and “Alice”.

This covers [T0] and [T1].
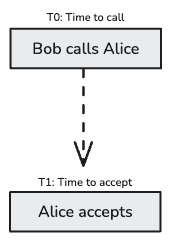
The journey begins at T0, Time to call, when Bob initiates a call to Alice. This phase primarily involves application-level signaling, which is outside the scope of WebRTC’s direct peer-to-peer connection but is a crucial prerequisite. On Alice side, this is where the application displays a call popup with the possibility to accept or decline the call.
Alice accepts the call.
This covers [T2] + [T3] and [D1].
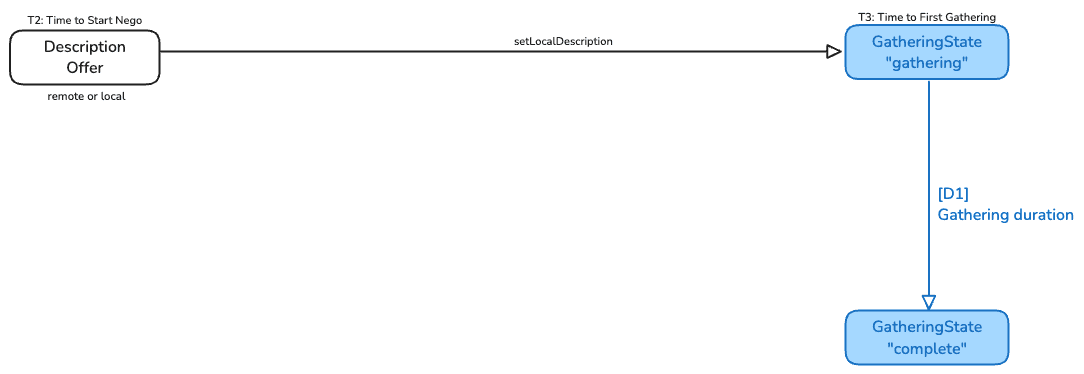
Once Alice has accepted the call, on Bob side, the application initiates the RTCPeerConnection which means all the stuff to get the audio and video media and sending the offer. Adding the local description to the peer-connection starts the gathering of ICE candidates (T3). The equivalent is done on Alice side.
Once all candidates have been collected, the Gathering State transits to complete which allows to compute [D1]. When trickling ICE is not used, having a long gathering period due to unresponsive STUN/TURN or complex network topologies can delay the connection establishment. [D1] is a first indicator that may help to diagnose network issues.
This covers [T4], [T5] and [D0].
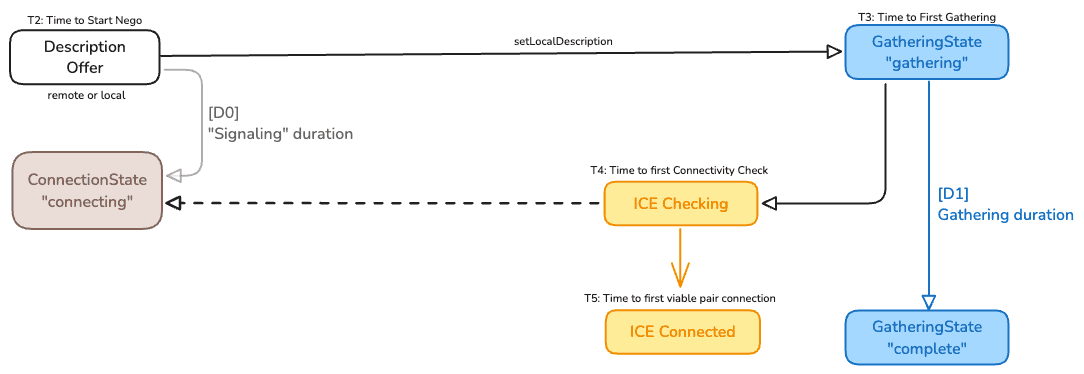
As soon as possible, the ICE agents on both peers begin testing pairs of local and remote candidates to find a working path. This is depicted as ICE Checking in [T4] which is reflected to the RTCPeerConnection connection state which moves to connecting.
The signaling duration [D0] can then be deduced. This is the time lost before really starting to find the path to connect.
When a suitable candidate pair is found and when the connectivity is established, the ICE state moves to connected, shown in the image as ICE Connected at [T5]. Reaching this step means that a UDP (or potentially TCP) path has been successfully established between the peers.
This covers [T6] and [D2].
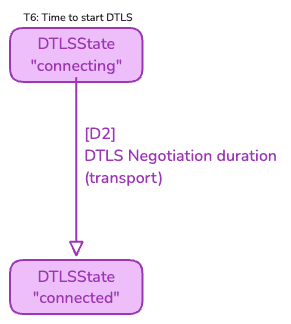
Once ICE establishes a data path, the next critical step is to secure the media. This is achieved through the Datagram Transport Layer Security (DTLS) handshake, which occurs over the ICE-established connection.
This part starts when the DTLS state associated to the transport switches to the connecting, at [T6] and ends when the DTLS state reaches the connected state.
[D2] represents the duration of this period.
A failure during the DTLS handshake would prevent the media to connect and the DTLS state will transit to failed. This is a common failure scenario; firewalls or network middleboxes might permit the initial UDP packets for ICE checks but interfere with or block the subsequent DTLS handshake packets due to their different characteristics (e.g., deep packet inspection or blocking unrecognized TLS-like protocols).
This covers [T7] and [D3], [D4]
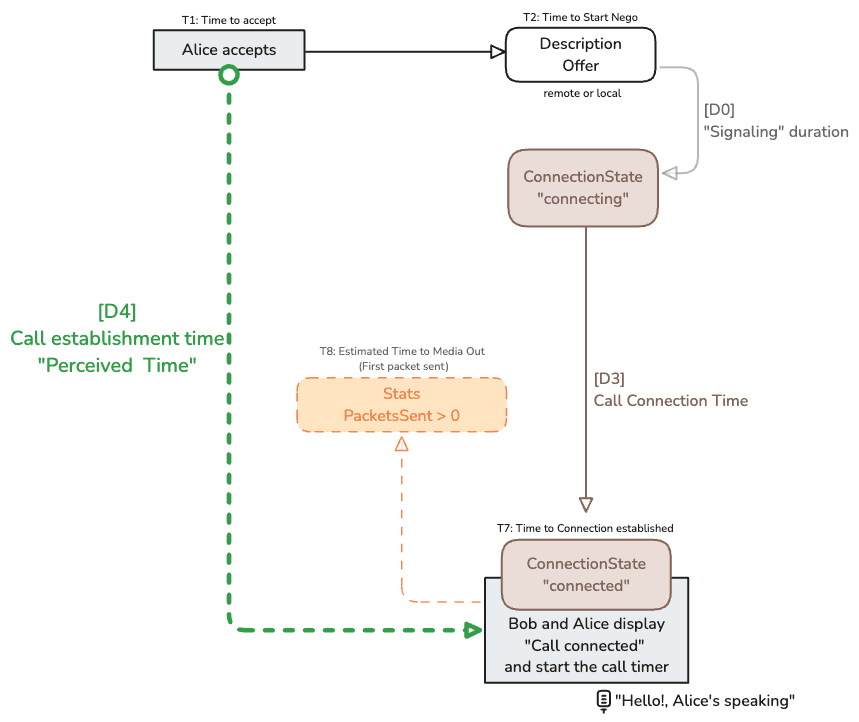
Once the DTLS state moves to “connected”, the connectionState also moves to connected assuming both ICE and DTLS have succeeded. At this juncture, the application can confidently inform the users that the call is connected.
Reaching [T7] allows to compute to indicators:
[D3] which is the connection time meaning the time it took to establish the connection and secure it.
[D4] which is the Call Establishment Time which affects the user. It is the perceived time of the connection meaning that this is the period when Bob and Alice saw the “connection in progress” banner. A crucial metric for user experience.
Following this, the media can flow.
Note: Here we take for granted that there is no significant delay between the 2 peers for reaching this state (some milliseconds).
This covers [T8].
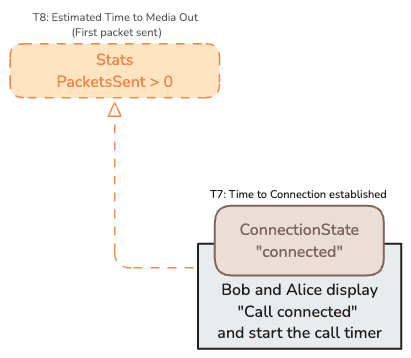
Here we are not totally accurate. [T8] is an approximation of the timestamp when the first packets are sent because there is no event fired when it happens. But you can “hit” the RTCRtpSender getStats as quickly as possible using requestAnimationFrame to obtain the first report when you will see packetsSent with a value greater than 0.
It will perhaps help detecting the 0,01% cases of calls with a late start…
This covers [T9], [T10] and [D5].
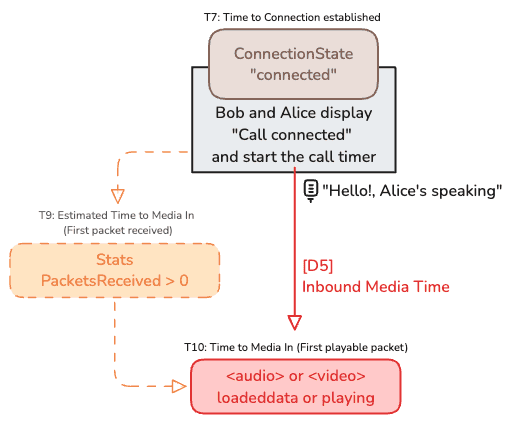
As trying to figure out [T9] in the same way than [T7] is not really accurate, it is better to measure [T10] which is the time when the HTML Audio fires the event loadeddata or playing. This implies that the browser has received enough data to begin playback.
[D5] will then be computed as the time it takes to receive the “first” inbound audio packets. The same can be done for video.
This covers [T11] and [D6], [D7].
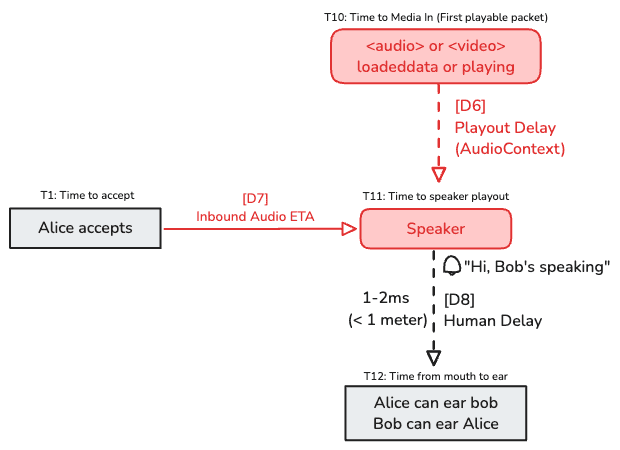
By using an AudioContext, we can get the latency introduced by the speaker used and calculate an estimated time of playout.
This can be also done by using the not standardized totalPlayoutDelay property in the media-playout report.
If, by mistake, a device is connected via AirPlay, the latency will unfortunately increase to as much as 2000 ms. This can ruin the call.
We are able to compute the time when the first packet should be audible by the user. This is called the Audio ETA: This is end-to-end time for Alice to hear Bob.
When everything works correctly, the Audio ETA is typically under one second. On mobile devices, it may take slightly longer — sometimes a second or more. However, this critical phase happens over a very short timespan, making it difficult to debug.
Fortunately, as we’ve seen, the WebRTC stack provides rich diagnostic data, which makes it possible to compute detailed statistics for each step of the process.
Another advantage is that we get visibility at multiple layers: by listening to state changes, the application can pinpoint exactly where things go wrong.
Each layer handles errors in its own way.
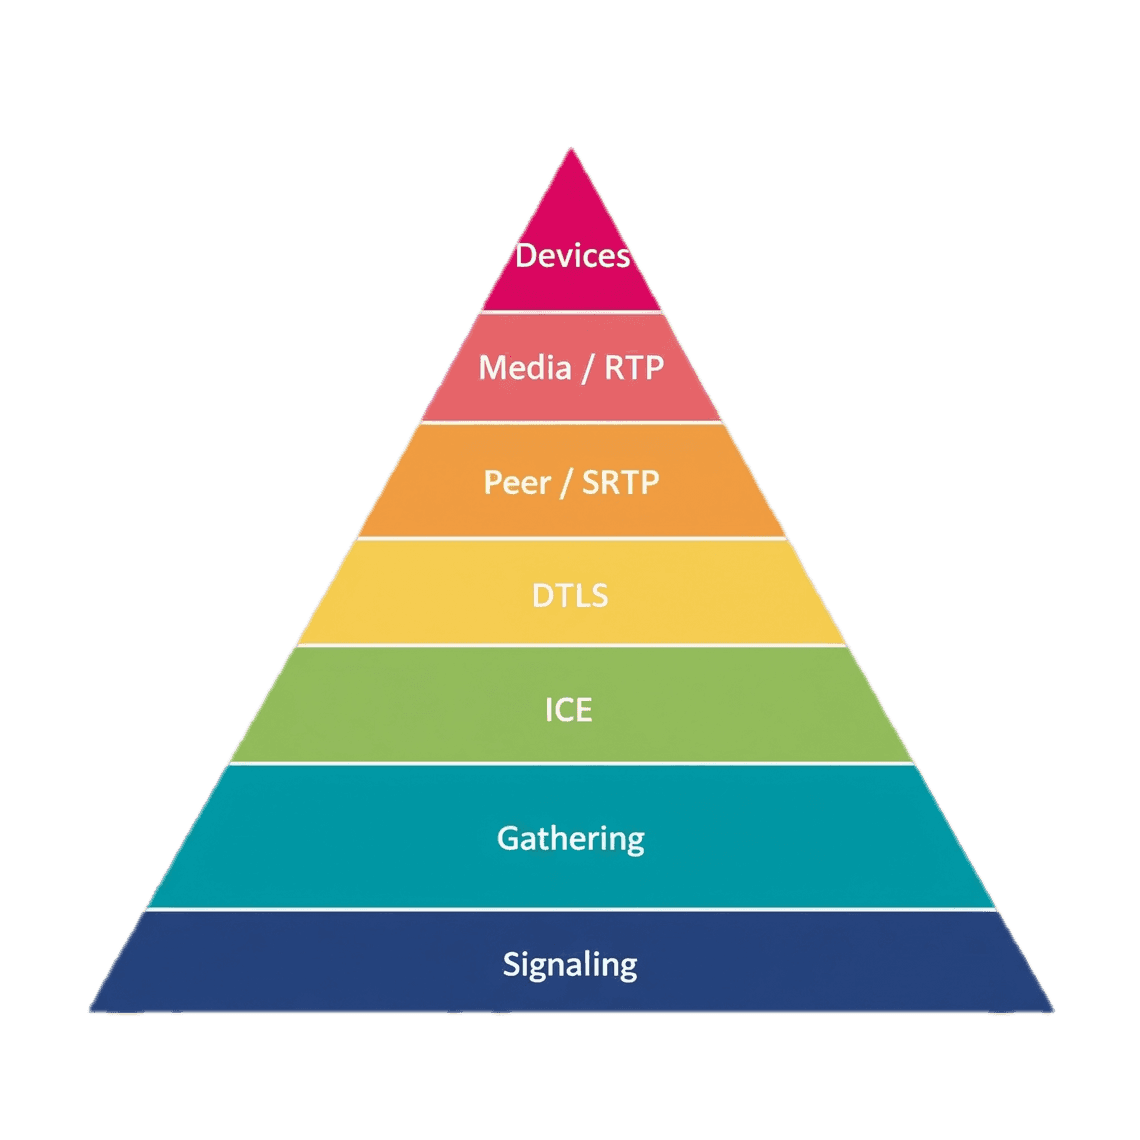
| Level | Trigger |
|---|---|
| Signaling | Fulfillment or failure of API used SignalingState changes |
| Gathering | gatheringState changes |
| ICE | ICEConnectingState changes ICEStandardizedConnectionState |
| DTLS | DTLSTransportState changes Limited to Handshake error? |
| Peer or STRP | ConnectionState changes |
| Media or RTP | HTML5 events or alternatives |
| Devices Input-Output | MediaDevices (input/web) or external interfaces (native) |
Note: To detect issues related to hardware devices, native applications must rely on external interfaces. On desktop platforms, this is often achieved by integrating an SDK or library provided by the device manufacturer to enable direct communication with the hardware.
Developers often wonder which event to rely on to determine when a WebRTC call is actually connected.
Here are some clarifications:
There are several situations where monitoring the states of the RTCPeerConnection can provide valuable insight:
a) iOS user denies local network access:
If the user inadvertently denies permission to access the local network (introduced in iOS 14+), the behavior is surprising: ICE still appears to succeed.
That is, the stack successfully gathers local candidates, forms candidate pairs, and even selects one. However, when it actually tries to use the network interface, the OS silently blocks it. This can lead to confusing behavior unless you’re monitoring transport-level events and peer-connectionState event.
b) Android user enters the office (network change mid-handshake):
This is a known edge case: if a user moves into a new network environment (e.g., from mobile data to office Wi-Fi) just as the DTLS handshake is starting, the route can suddenly become invalid.
Instead of failing gracefully, the DTLS layer may attempt retransmission indefinitely, with logs showing repeated messages like DTLS retransmission…
Normally, the handshake should complete in just two RTTs. But in this scenario, it can take too long. Often, the user ends the call before a failure is even reported by the ICE layer.
c) Frequent switching between Wi-Fi bands:
In this case, the device (e.g., a laptop) repeatedly switches between 2.4 GHz and 5 GHz Wi-Fi bands due to poor signal quality.
Each switch causes short media interruptions, typically under 10 seconds. The issue is subtle: ICE connection state remains unchanged (still “connected”), making it harder to detect.
Here, this highlights the importance of having multiple ways to monitor the connection (e.g., via statistics).
d) Actual DTLS-level failures:
Although rare, real DTLS failures do happen. Not seen on myself. In these cases, the DTLS transport state should transition to failed.
You may also see low-level logs like SSL Error, DTLS handshake failure, or similar. This usually indicates a configuration or cryptographic issue between peers.
At the application level, there’s no magic — but by carefully listening to all WebRTC events, the application can proactively recover from connection issues.
In particular, if the connectionState does not reach ‘connected’ within a short time (typically 2–3 seconds on mobile), the app can trigger an ICE restart to speed up recovery and avoid long delays.
An ICE restart is the only recovery mechanism available.. There is no other actionable API.
As a web developer, I initially overlooked the purpose of the iceStandardizedConnectionState, until I started digging into logs captured by the native WebRTC stack.
This property was introduced a few years ago to fix inconsistencies in the original iceConnectionState, without breaking backward compatibility. In native libWebRTC, the legacy iceConnectionState (now referred to as such) didn’t accurately reflect the actual ICE state—it behaved more like what the browser exposes as connectionState.
In contrast, iceStandardizedConnectionState is aligned with the W3C WebRTC specification and behaves as you’d expect if you’re familiar with ICE states from the web.
👉 If you’re building a native mobile or desktop application, you should rely on iceStandardizedConnectionState and avoid using the legacy iceConnectionState. It provides a more accurate and consistent view of the ICE process.
Note: There is a key difference between (1) connectionState = ‘connected’ and (2) iceConnectionState = ‘connected’. • The first (connectionState) is triggered as soon as the DTLS handshake succeeds, indicating that the transport is ready for encrypted media. • The second (iceConnectionState, considered legacy) is triggered after DTLS has completed and once the microphone (aka the recorder) is fully initialized and ready.
Because of this additional delay, iceConnectionState = ‘connected’ may be better suited for triggering UI elements like a “Call Connected” banner, where media readiness is more relevant than transport readiness alone.
Looking more closely at case (c), the logs from Chrome clearly show that the selected candidate pair is no longer receiving data:
ice_transport receiving state changed to 0
However, despite this, there is no change in state at the DTLS, ICE, or PeerConnection levels. From the user’s perspective, media has stopped — they can no longer hear their peer — yet no high-level WebRTC event is triggered to reflect this.
From what I can tell, beyond the state transitions exposed by the stack (like connectionState or iceConnectionState), there are no built-in triggers to detect or respond more quickly to this kind of issue — at least not from the WebRTC states.
The only alternative approach I’ve found is to call getStats() frequently — ideally every 100ms or 200ms — on both the RTCRtpReceiver and RTCRtpSender. By doing this, it’s possible to detect when no packets have been sent or received for a short period, even if the connection appears to be technically “connected.” This KPI provides an indication, but not definitive proof, that the local network is the root cause.
In most applications, getStats() is only called every 4–5 seconds (or even less frequently), which makes it impractical to detect such transient issues. This suggests a need to differentiate stats polling strategies based on use case — e.g., one for performance monitoring and another for connection health checks.
When reading native libWebRTC logs, I occasionally find low-level network-related warnings or failures that would be valuable to surface to the application layer — but there’s currently no way to expose these via the standard WebRTC JavaScript API.
This creates a gap in observability, especially on the Web, where accessing stack-level logs is not straightforward. In native apps, it’s at least possible to access system-level APIs and integrate diagnostics more deeply.
In the browser, where we lack access to native logs and low-level transport hooks, we’re left relying primarily on:
The “few” exposed RTCPeerConnection events,
Stats polling via getStats().
Then for post-motem analysis, we need to send manual debugging instructions for end users (e.g., how to enable Chrome’s internal logs)…
This situation leaves developers — and even support engineers — feeling a bit like a “bunny trying to escape the hunters”: possibly aware of a problem, but with very few possibilities to react quickly.
WebRTC issues can be as unpredictable and chaotic as in Westworld, thanks to the wide range of potential failures across networks, devices, and environments.
But if your application can clearly communicate to the end-user that the problem doesn’t originate from the app itself, that’s already a significant win.
The next step is to empower IT teams — instead of simply pointing fingers at “the network”. With the right diagnostics and visibility, they can work to improve the overall reliability of the solution.
It’s not just about fixing problems — it’s about building trust and creating a Win–Win for you and your customers.